 Paulo Castellano
Types of User Feedback (& What Conclusion You Can Make From Them)
Learn about different types of user feedback, how to interpret them, and how smart feedback management can power your SaaS growth and customer loyalty.

Feedbacks can make or break your SaaS product.
Understanding the different kinds of feedback, and knowing which to act on, lets you focus your efforts where they matter most.
When you are building a SaaS from scratch, the single source of truth is the feedback you get regardless of the platform they come in.
Further, if you are regularly getting feedback, it helps you maintain a relationship that brings you more from the same user again and again.
Now I am not saying that each feedback you get should be what you focus upon and in this read we differentiate them to pinpoint each type with specific examples so that you can understand them better.
Different Types of Customer Feedback You Should Focus for Your SaaS
Customer feedback breaks down into four main buckets: active, passive, quantitative and qualitative, all of which can be better understood through effective customer analytics
Each one has its own importance and knowing in detail will help you to organize feedback better.
Active feedback comes from the surveys and polls you send. Passive feedback shows up in comments, reviews and social posts without prompting.
Quantitative feedback gives you numbers to track over time. Qualitative feedback lives in open-ended responses, tickets and interviews.
Let’s go in detail about each one.
Active Feedback
These are the metrics and surveys you send directly to users. You control who sees them and when, so you get consistent, comparable data points.
The action plan here will be that you reach out to some specific people, these may be surveys, asking people about how they liked the new feature, or if they didn’t like the new feature.
I have discussed some of them in detail below with specific pointers and with an example.
Net Promoter Score (NPS)
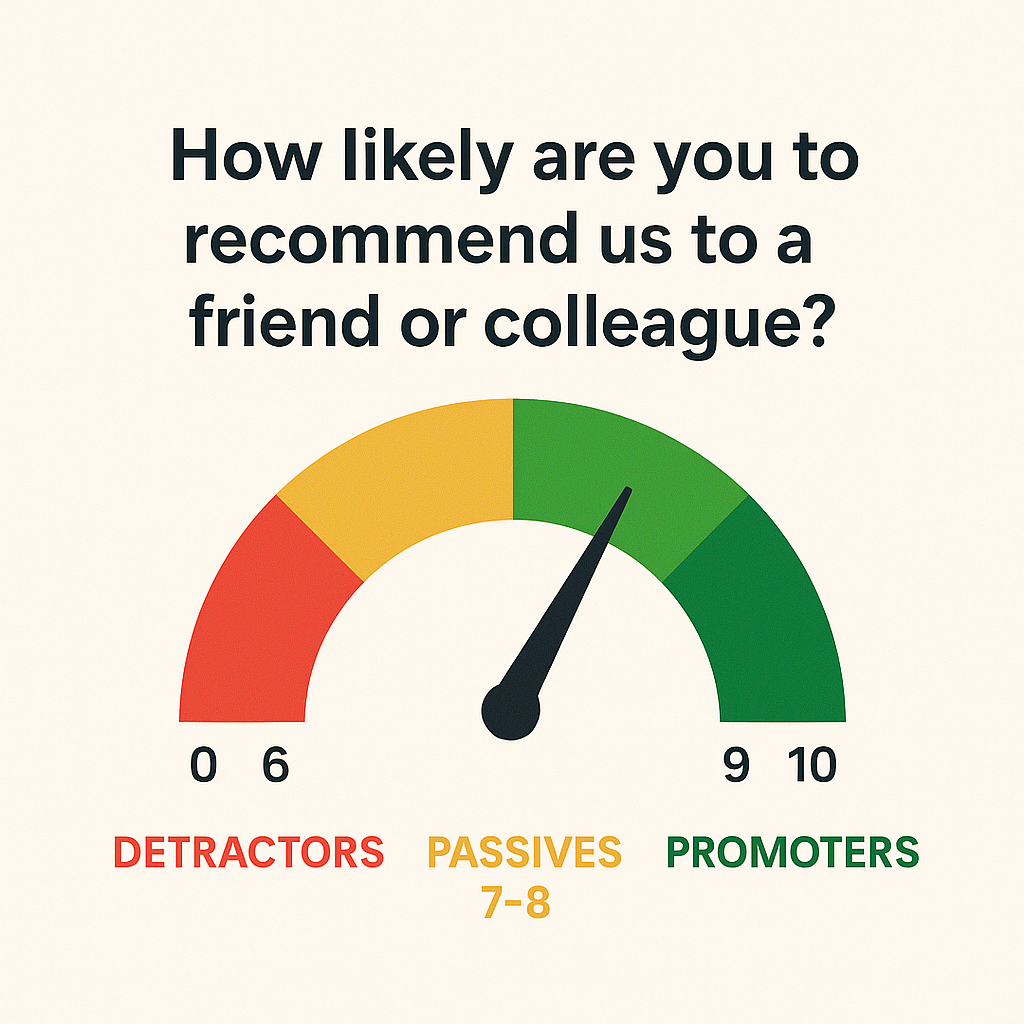
- What it is: A single-question survey asking “How likely are you to recommend our product to a friend or colleague?” on a scale from 0 (not at all) to 10 (extremely).
- How it works:
- Promoters (9–10): Loyal enthusiasts likely to refer you.
- Passives (7–8): Satisfied but unenthusiastic, vulnerable to competitors.
- Detractors (0–6): Unhappy customers who can damage your reputation.
- Why use it: Quick pulse on overall loyalty. Track changes over time or before/after major releases.
- Caveat: Doesn’t explain why someone gave a low score, what you can do is pair with a follow-up question to get context.
- Example: Three weeks after signup, you email every user an NPS survey, “On a scale of 0–10, how likely are you to recommend us?”, to spot shifts in loyalty as they explore core features.
Customer Satisfaction Score (CSAT)
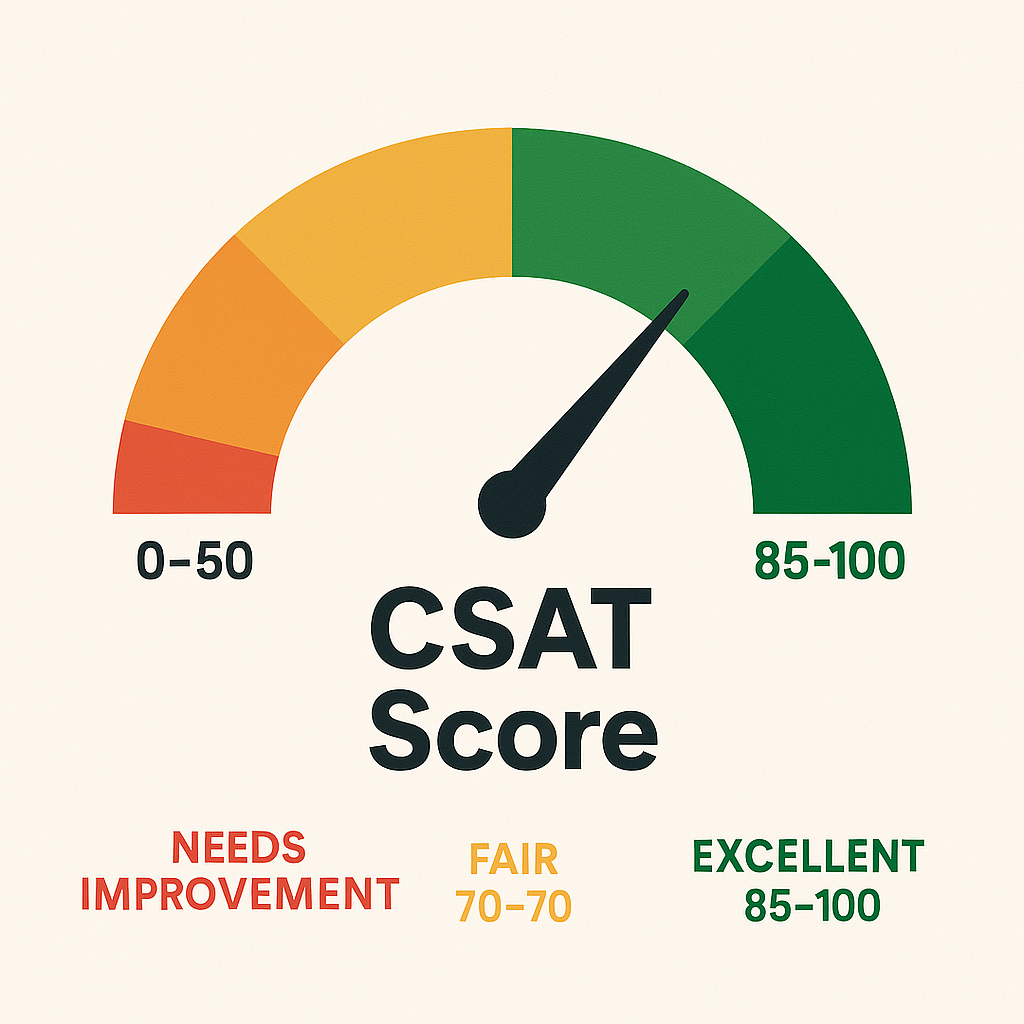
- What it is: A short survey asking “How satisfied are you with [specific interaction or feature]?” often on a 1–5 or 1–7 scale.
- How it works:
- Calculate % of respondents who select the top two boxes (e.g., 4 or 5 out of 5).
- Why use it: Measures satisfaction with a particular touchpoint, onboarding flow, support experience, a new feature.
- Caveat: Moment-in-time snapshot. High CSAT on a support ticket doesn’t mean overall product health is good.
- Example: Immediately after closing a live chat support ticket, you can trigger a CSAT (“How satisfied were you with our help?”). A drop from 90% to 70% in CSAT flags an opportunity to improve your support scripts.
Customer Effort Score (CES)
- What it is: A survey asking “How much effort did you personally have to put forth to [complete task]?” on a scale from “Very low effort” to “Very high effort.”
- How it works:
- Lower effort scores correlate with higher loyalty and lower churn.
- Why use it: Identifies friction points in processes, suppose in signup, billing, support resolution.
- Caveat: Best used immediately after a task. Doesn’t capture emotional satisfaction or delight.
- Example: Right after a user completes the signup flow, trigger a CES asking “How much effort did you have to put forth to create your account?” If a large share selects “high effort,” you know your form fields or verification steps need simplification.
In-App Ratings
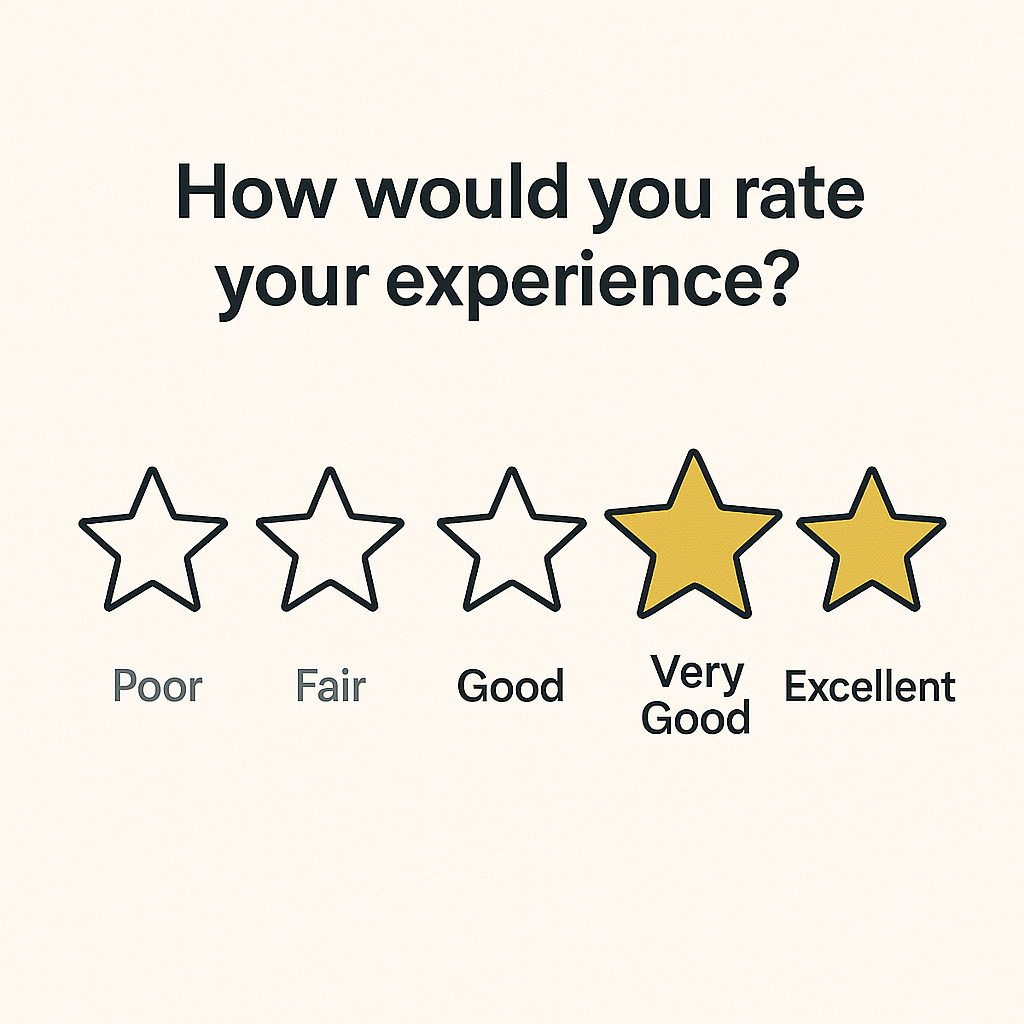
- What it is: A lightweight feedback prompt embedded directly into your product, often as stars (1–5), thumbs up/down, or emoji reactions, asking users to rate a specific feature, page or interaction.
- How it works:
- Users click a star or icon immediately after using a feature (e.g., “Rate this report: ⭐⭐⭐⭐☆”).
- The rating is recorded alongside user metadata (plan level, session length) for analysis.
- You can optionally follow up with a one-line open text: “Any quick thoughts on why you picked this rating?”
- Why use it:
- High response rates: Low friction means more users give feedback.
- Contextual insights: Ratings tied to exactly where the user was in your app reveal which features delight or frustrate.
- Trend tracking: See which modules improve (or worsen) over time as you ship updates.
- Caveat:
- Lacks depth: A star alone doesn’t explain the “why”—pair with occasional qualitative prompts or flag low ratings for deeper follow-up.
- Bias risk: Power users may self-select into giving feedback; casual users may ignore prompts.
- Example: Right after someone generates a PDF report, display a 5-star widget in the corner: “How useful was this report?” If you see a sudden dip from an average of 4.5 to 3.2 stars, dig into session logs or trigger a short in-app survey to uncover whether recent layout changes caused confusion.
Sales Objections
Sales objections are the concerns or reasons prospects give when they hesitate or decline during demos, calls or email exchanges. Capturing and analyzing these objections helps you identify deal-breakers early and shape your product roadmap accordingly.
- What it is:
Sales objections range from pricing concerns (“It’s too expensive”) to missing features (“We need bulk import”), integration hurdles (“Doesn’t support our SSO”) and trust questions (“Is support available 24/7?”). These are direct signals from buyers about what’s stopping them from signing up. - How it works:
During every demo or sales call, your reps log objections in your CRM or a shared feedback board. Each concern is tagged under a standard category (price, features, integrations, support). Over time, you review which objections pop up most often—some teams even hold a weekly objection-triage meeting to spot trends. - Why use it:
Objections reveal the gaps between what prospects expect and what your product delivers. Frequent price objections might mean you need to revisit packaging. Recurring feature gaps highlight must-haves for your next release. Tackling top objections boosts your win rate and ensures your roadmap solves real buyer pain. - Caveat:
This feedback comes only from engaged prospects, not all users. A spike in objections could reflect unclear sales messaging rather than a true product gap. Always cross-check objections against user surveys or product analytics before making big changes. - Example:
After logging objections from 20 enterprise demos, you find “no SSO support” cited in 12 lost deals (60%). That clear pattern shows you must build SSO before targeting larger customers—without it, you’ll keep losing those deals.
Churn Reasons
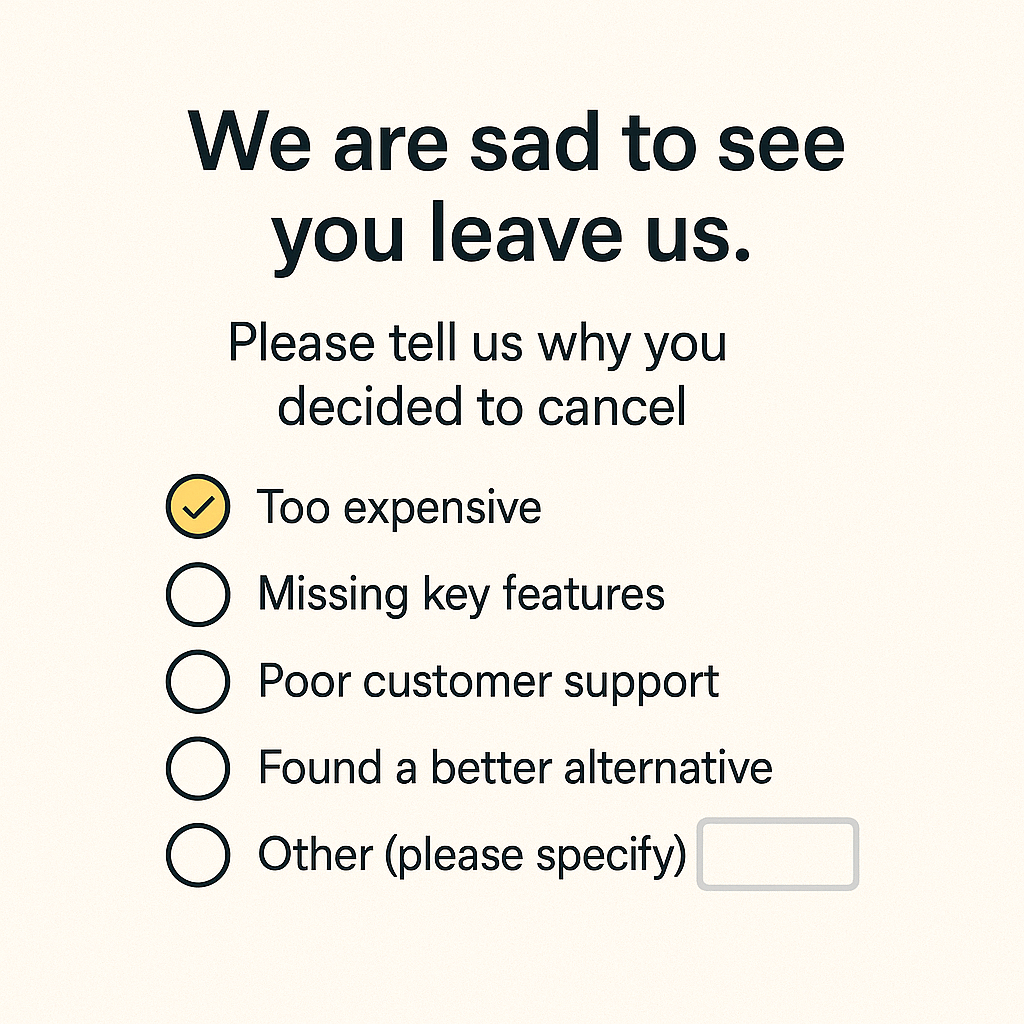
- What it is:
A targeted survey or prompt shown during the cancellation flow asking “Why are you leaving?” Often a mix of checkbox options (e.g., “Too expensive,” “Missing feature,” “Switching to competitor”) plus an open-text field for details. - How it works:
- Exit Survey Trigger: Immediately as a user clicks “Cancel,” present a brief form with 3–5 predefined reasons and an “Other” box.
- Follow-up Call/Email: For high-value accounts, your customer success team may follow up to log additional context.
- Logging & Tagging: Each selected reason is tagged (pricing, UX, performance, integrations) and open-text responses are stored for qualitative analysis.
- Why use it:
- Pinpoint Top Drivers: See at a glance whether cost, usability or missing features cause the most churn.
- Prioritize Fixes: Focus development on the issues that directly reduce cancellations.
- Improve Messaging: If “found cheaper alternative” spikes, revisit your pricing page or value positioning.
- Caveat:
- Low Response Rates: Many users skip exit surveys, your data may under-represent true drivers.
- Superficial Answers: Users often pick the first checkbox they see; open-text fields are key to uncover hidden reasons.
- Bias Toward Recent Frustrations: A single bad experience (e.g., billing glitch) can overshadow longer-term issues.
- Example:
After rolling out an exit survey, you discover 40% of churners select “Missing mobile app” and 25% choose “Price too high.” A closer look at comments reveals “I only use this on phone,” prompting you to accelerate mobile development and test a lower-tier pricing plan.
Customer Surveys
Comprehensive questionnaires sent to targeted user groups to gather detailed insights on product usage, satisfaction levels, feature requests and pain points.
- How it works:
- Design & Segmentation: Craft 8–12 questions mixing rating scales (e.g., 1–5 satisfaction) with open-ended prompts (“What one feature would you add?”). Choose segments, new users, power users, churned accounts, for specific questions.
- Distribution Channels: Send via email, embed in your app’s dashboard, or link from your newsletter. Stagger timing (e.g., quarterly or after major milestones) to avoid survey fatigue.
- Analysis & Reporting: Blend quantitative results (average satisfaction scores, top feature votes) with qualitative comments. Export to your analytics tool or review directly in spreadsheet form.
- Why use it:
- Broad, Structured Insight: Unlike NPS or CES, surveys let you ask multiple, focused questions in one go, ideal for deep dives into specific areas (pricing, onboarding, feature usage).
- Segmentation Power: Compare responses across cohorts (e.g., free vs. paid, industry vertical) to spot differences in needs and satisfaction.
- Longitudinal Tracking: Repeating the same survey quarterly reveals shifts in sentiment or priority over time.
- Caveat:
- Response Rates: Longer surveys see diminishing returns, keep them concise and communicate why their input matters.
- Question Bias: Poorly worded or leading questions can skew results; pilot your survey with internal teams first.
- Analysis Overhead: More questions mean more data to process, plan for tagging themes and summarizing comments in advance.
- Example:
At the end of each quarter, you send a 10-question survey to all active users asking about satisfaction with key features, ease of setup, and top improvement requests. You discover that 70% rate reporting features below 3 out of 5, and the most-requested enhancement is a customizable dashboard, guiding your next sprint planning.
Onboarding Feedback
Feedback collected during the first interactions users have with your product, it is vital for smoothing the path from signup to active use.
- What it is:
Short surveys or prompts shown during or right after the onboarding flow. Often a single question like “How easy was it to set up your account?” or “Did you find our tutorial helpful?” - How it works:
- Trigger Points: Display an in-app prompt once the user completes key steps, account creation, first project, or tutorial finish.
- Format: Use a simple 1–5 scale, thumbs up/down, or emoji slider. Optionally follow with “What could we improve?” in an open-text field.
- Collection: Responses are stored alongside user metadata (plan type, referral source) for segmentation.
- Why use it:
- Spot Early Friction: Identify confusing steps or missing guidance before users abandon.
- Improve Activation Rates: A smoother start boosts the number of users reaching “aha” moments.
- Guide Tutorial Iteration: Use open-text comments to refine help text, videos, or tooltips.
- Caveat:
- Limited Sample: Only new users see this—long-term users won’t provide insights on onboarding.
- Timing Sensitivity: Ask too early and you’ll misinterpret frustration; ask too late and you’ll miss the moment.
- Example:
Right after a new user completes your interactive setup wizard, display a two-part prompt:
- “How easy was it to complete the setup?” (1 = Very difficult, 5 = Very easy)
- “Any suggestions to make this smoother?”
If you notice an average score below 3, review session recordings to pinpoint where users struggle and update the wizard steps accordingly.
Feedback After a Support Interaction
Feedback gathered right after your support team helps a user, it can be essential for measuring service quality and spotting training needs.
- What it is:
A brief survey sent as soon as a ticket is marked “resolved” or a live chat ends. It usually asks a CSAT question (“How satisfied are you with our support?”) or a CES question (“How easy was it to get your issue fixed?”). - How it works:
- Trigger: Automatically send an email or in-app prompt when the support ticket closes.
- Format: Use a simple scale (e.g., 1–5 stars or “Very easy” to “Very hard”). Optionally follow with one open-ended question: “What could we do better?”
- Capture: Log the score and text response alongside the ticket data (agent name, issue type).
- Why use it:
- Spot skill gaps: Low scores on certain issue types highlight where agents need more training.
- Improve processes: High effort scores on billing tickets might mean your billing flow needs redesign.
- Boost retention: Fast, helpful support keeps users from looking elsewhere.
- Caveat:
- Response bias: Users who had very good or very bad experiences are more likely to reply.
- Timing matters: If you wait too long after resolution, feedback loses context.
- Example:
After closing a ticket about a broken integration, you send a CSAT survey:
“On a scale of 1–5, how satisfied are you with our support today?”
You see a trend of 2- and 3-star answers for integration tickets. That tells you to update your integration docs and run a training session for support on that topic.
Passive Feedback
Passive feedback is the input users share without being asked. It shows up in app comments, social posts, public reviews or forum threads, unfiltered and in real time. Because you didn’t trigger it, you capture genuine reactions and unexpected pain points. In the sections below, we’ll explore where passive feedback lives, how to gather it, and what insights you can uncover.
In-App Comments
In-app comments are notes or questions users drop directly inside your product via feedback widgets, chat icons or “Give feedback” buttons. They capture user sentiment at the exact moment of use, when frustration hits or delight sparks.
Because they’re unsolicited and contextual, you often see precise pointers: a mislabeled button, a confusing dropdown, or a workflow hiccup. To collect them, embed a lightweight widget on key pages or flows (e.g., settings, report exports). Then tag comments by category (bug, feature request, UI) and review regularly.
- Why it matters: You catch issues as they happen, before they turn into support tickets or churn.
- Caveat: Volume can spike after major releases, prioritize by frequency and severity.
- Example: After rolling out a redesigned dashboard, you spot multiple comments on the “Filter” icon’s placement. That tells you to revisit the layout before more users struggle.
Public Reviews
Public reviews live on third-party sites like G2, Capterra, the App Store or Google Play. Users rate your product (often with stars) and leave written feedback about strengths, weaknesses and overall experience.
These reviews shape your reputation for prospects and influence buying decisions. Scrape or integrate review feeds to pull in new ratings automatically, then analyze trends: common praise (e.g., “easy setup”) and recurring complaints (e.g., “slow reports”).
- Why it matters: You gain visibility into how strangers perceive your value—and collect testimonials you can showcase.
- Caveat: Reviewers skew extreme—very happy or very unhappy users are overrepresented. Balance with internal feedback.
- Example: A sudden drop from 4.5 to 3 stars on Capterra after a UI overhaul signals you need to address navigational pain points.
Social Media Mentions
On Twitter, LinkedIn, Facebook or niche forums, users often tag your product when sharing wins, airing grievances or asking the community for help. These mentions give you an unfiltered look at real-world use cases and brand sentiment.
Set up keyword listeners or hashtags to capture every mention, then categorize by topic (feature use, bug, praise).
- Why it matters: You uncover novel use cases and spot viral feedback early—both positive and negative.
- Caveat: Noise and off-topic chatter can drown out valuable signals; use filters and human review.
- Example: A popular influencer tweets a workaround using your API in a new industry, inspiring you to build a dedicated integration.
Forum & Community Threads
In public forums like Reddit, StackOverflow, Slack/Discord channels or your own user community, power users discuss workarounds, share scripts and suggest improvements. These threads reveal sophisticated use cases and edge-case bugs you might never get through surveys. Monitor relevant subreddits, tag questions by theme, and engage directly to clarify pain points.
- Why it matters: You tap into deep expertise and build goodwill by helping solve problems in real time.
- Caveat: Advice and hacks from users can sometimes be wrong or insecure—verify before baking into your product.
- Example: A thread on integrating your tool with a legacy system uncovers missing API endpoints, leading to a prioritized feature build.
Support Tickets & Live Chat Logs
Whenever a user emails support or starts a chat, they’re sending passive feedback about hurdles, bugs or how-tos.
These logs contain structured data (issue type, resolution time) and unstructured nuggets (frustrated quotes, screenshots). Export tickets from Zendesk or Intercom and tag them by category. Review weekly to spot frequent questions or error patterns.
- Why it matters: You identify friction in workflows and gaps in documentation.
- Caveat: High-value accounts may bypass self-help; ensure you capture feedback from all tiers.
- Example: Multiple tickets report a “500 error” when exporting CSVs. That points straight to a backend bug rather than a UI issue.
Email & Direct Messages
Replies to your newsletters, inbound sales or support emails, and DMs on social channels often contain thoughtful, high-value feedback. These messages might describe unique workflows, partnership ideas or deep feature requests.
Because they come via one-to-one channels, they’re usually from engaged users who care enough to write. Forward or tag these conversations in your feedback system, then follow up when you need clarification.
- Why it matters: You get detailed narratives and context, plus an opportunity for direct dialogue.
- Caveat: Manual capture is time-consuming—consider forwarding rules or integrations with your feedback board.
- Example: A power user emails a three-paragraph use case for automating report distribution. That detailed scenario becomes a candidate for a new scheduling feature.
Conclusion
Investing in feedback is not an extra cost to your business. It's your gateway to know your customers better, build a solid product and finally give your users what they actually want.
So, I would rather call it an investment. Yes, there are challenges in collecting feedback and this might grow as your product grows.
But then you have to adapt to the changes, your product will not remain the same as it once started, so would be the feedback you receive.
By treating feedback as an ongoing cycle, you also get to:
- Close the loop – Thank users when you act on their requests and show them progress.
- Measure impact – Watch your NPS, CSAT and churn rate improve as you ship the right features.
- Build trust – A transparent, user-driven roadmap keeps customers engaged and loyal.
Changelogfy is a platform that can help you to collect feedback, analyze them and priorize them.
If you're stuck with any challenges in getting feedback, reach out to me on chat, & I am happy to help!!
Happy Feedback Collection🎉!!
Share this article